
Anomaly detection explained with football

It is Sunday morning, you are having your coffee, and you’re reading the newspaper as you usually do. As a football fan, you go to the sports session to see the last results of the previous matches and then… something grabs your attention (and also almost make you drop the coffee on yourself!)… A second division team won the most competitive European championship! In your head, there is only one thing that comes to your mind is “Whaaaat?!”.
Yes, the act of noticing or discovering something unusual or strange enough to be noticeable (i.e., being surprised!) is what we call Anomaly Detection (Cambridge Dictionary N.A.).
The anomaly detection is a technique that could be applied to different situations (Dutta & Vallabhajosyula, 2017):
- Telecom: Detecting roaming abuse, revenue fraud and service disruptions;
- Banking: Flag abnormally high purchases/deposits and detect cyber intrusions;
- Finance & Insurance: Detect and prevent the pattern of fraudulent spend and travel expenses;
- Healthcare: Detect fraud in claims and payments;
- Manufacturing: Detect abnormal machine behaviour to prevent cost overruns;
- Social Media: Detect compromised accounts and bots that generate fake reviews;
- Networking: Detect intrusion into networks;
- Smart house: Detect energy leakage;
- Video Surveillance: Detect or track objects and persons of interest;
Analytical as you are, you got curious to see how to use this technique to identify atypical events of your favourite football team, for example, unexpected wins or loose with unusual scores. But, before starting to search for data, it is important to understand another key concept to apply Anomaly Detection techniques. This concept is called time-series.
Time-series “is a set of regular time-ordered observations (…) taken at successive, in most cases equidistant, periods/points of time.” (OECD.org, N.A.). In our football example, the time-series data is the historical data of all the matches and the number of goals, pros and cons in each match.
Merging the concept of Anomaly Detection and Time-series, we could say that Time-series Anomaly Detection is the identification of rare events that have differing characteristics from the majority of time-ordered processed data (DeepAI.org, N.A.).
Again, back to our example, we could assume that the objective of using this technique is to identify, at the historical data, the matches where our team won or lost with an unusual score difference.
To simplify the analysis, let’s create a new variable called ‘number of goals net’ (num_goals_net) that will represent the number of goals in favour minus the number of goals against. After searching on the Internet to get the dataset and some data wrangling work, we arrive at the plot below for our team, which illustrates our new variable values across time.
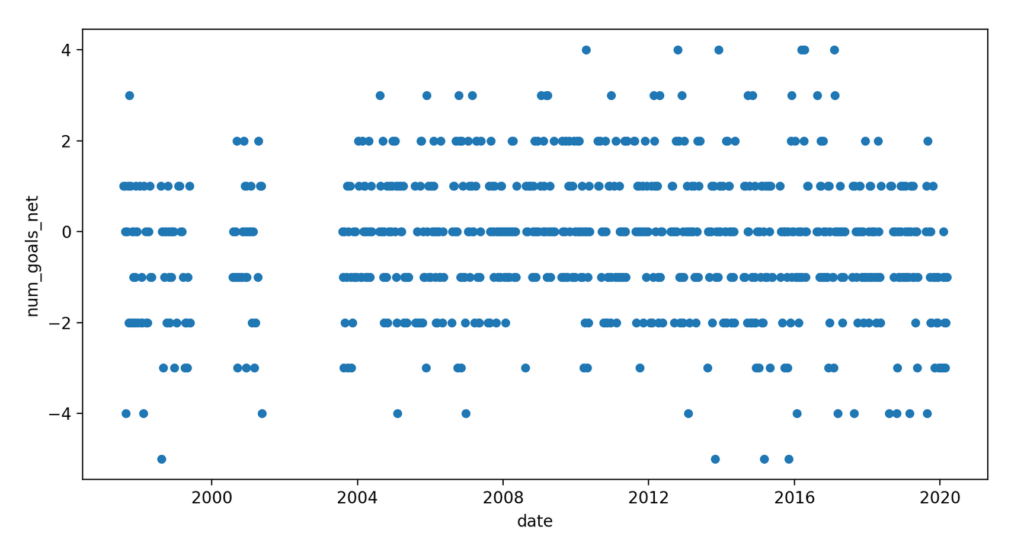
A quick look at the plot shows that most of the results across time are in the range -2 and 2, in terms of ‘num_goals_net’. The lower value means matches that the team lost from a difference of 2 goals, and the higher one matches where they won from a different of 2 goals. It looks like everything out of that range are events considered unusual/atypical/less frequent. After using the anomaly detection techniques, we could see clearly that the interpretation looks correct:
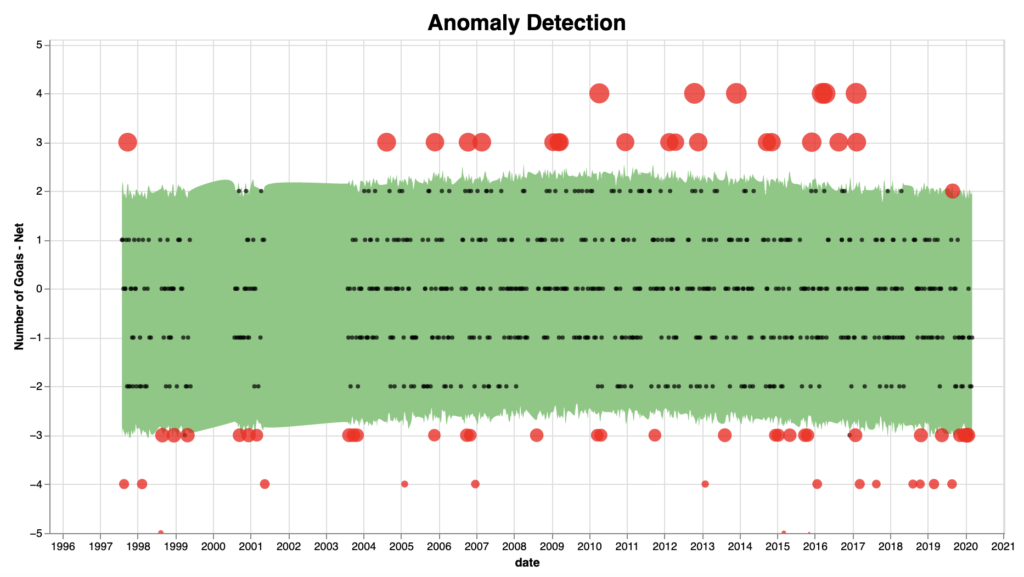
The green area shows the majority of the events (around 90% of the cases), and the red dots are the anomalies detected by the algorithm.
Curious to know more about the anomaly detection techniques? How can you use that on your business cases? Feel free to contact us for a more in-depth discussion !
References – Accessed at 22 February 2021:
- Cambridge Dictionary, N.A. ‘Anomaly’ [ONLINE]. Available here
- Cambridge Dictionary, N.A. ‘Detection’ [ONLINE]. Available here
- DeepAI.org, N.A. ‘Anomaly Detection’ [ONLINE]. Available here
- Dutta, S., Vallabhajosyula, R. R., 2017. ‘Anomaly Detection – Real World Scenarios, Approaches and Live Implementation’ [SLIDESHARE]. Available here.
- OECD.org, N.A. ‘Time Series’ [ONLINE]. Available here
Commentaires :
A lire également sur le sujet :