
Coding versus Modeling: The modern life without the Pythagorean theorem…

What will happen if, today, hypothetically, we had just found the records of the Pythagorean triple?

Pythagorean triple from Babylonian times (Wikipedia.com).
First, I believe we would like to translate/re-write the content using modern notation. After some work with the help of experts, that’s how would probably look like that the results:
- (3, 4, 5)
- (5, 12, 13)
- (8, 15, 17)
- (7, 24, 25)
- (20, 21, 29)
- (12, 35, 37)
- …
Cool! Now, I believe we would like to understand the relationship between these numbers, right?
Probably scientists/mathematicians will try to understand and formulate an general rule for these triples, and eventually they will arrive in the famous Pythagorean equation:
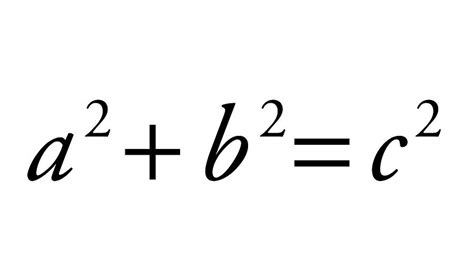
Pythagorean equation (Wikipedia.com).where in the triple representation will be (a,b,c).
With a bit of math, we arrive at:
Then, if we would like to « convert » that into a code, for example, in Python, it would probably look like:
def calculate_c(a, b):try:
        c = sqrt(a**2 + b**2)
        return c
    except Exception as e:
        print(e)
Job done! Anyone now could use that formula in their code.
But, maybe, some others people maybe will try to use Machine Learning to identify that rule. How they will do that?
First, there is a understanding of what are the independent and dependent variables in the triple. In our case, a and b are independent and c is the dependent one.
Then, they will love to have a lot of these triples! The pictures below illustrates the representation of these data using different amount of them:
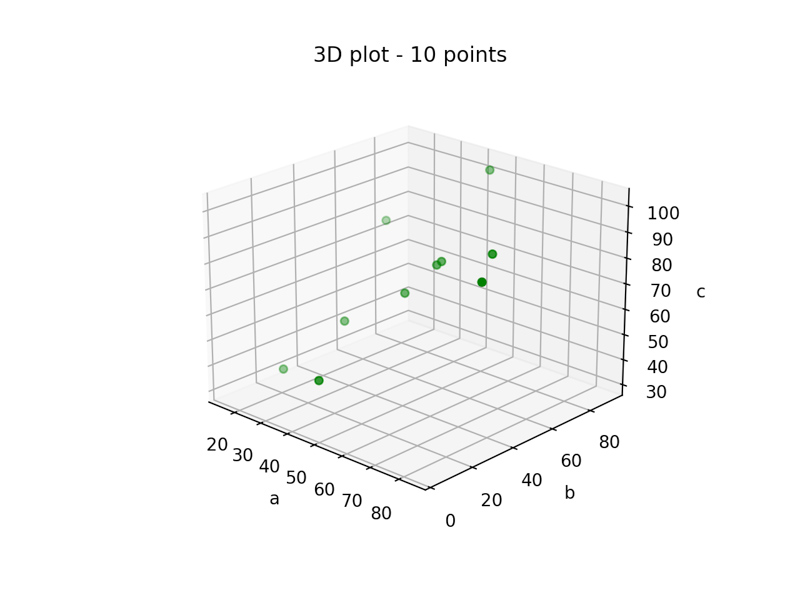
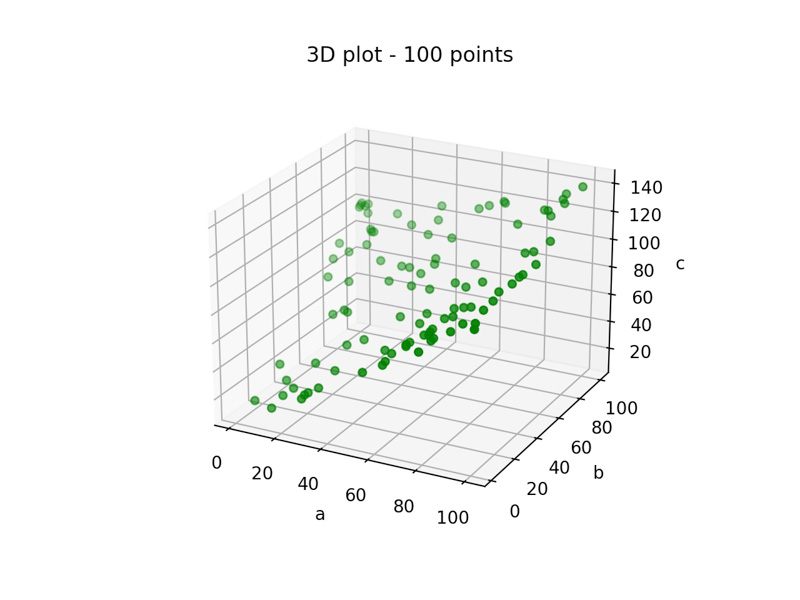
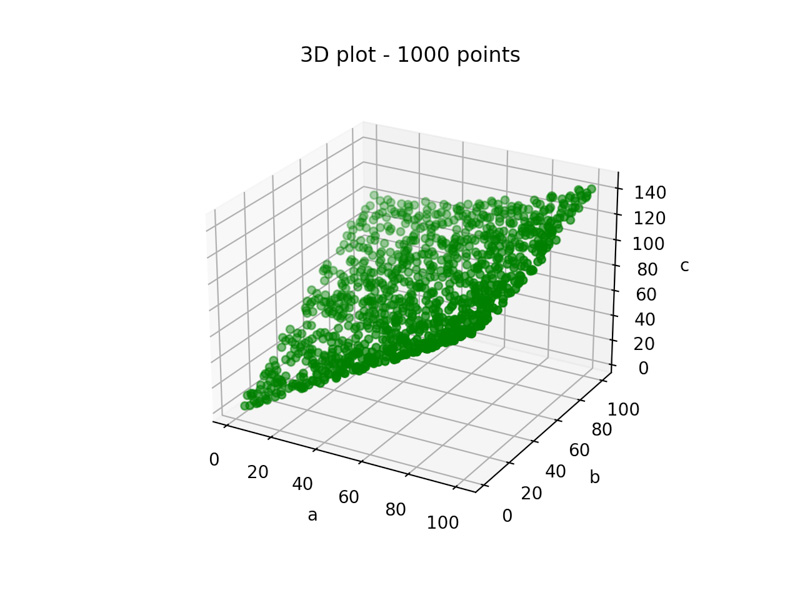
Multiples (a,b,c) triples visualization, with 10, 100 and 1000 points, respectively.
The question is: why they love a lot of data? Because it’s interesting to see that, as more points we have, easier become to start to understand the relationship between the points.
On this context, some initial conclusions could start to appear, like:
- The values are in the positive 3d-space;
- It’s a multivariate relationship, i.e., more than one independent variable (
aandb) to explain de independent one (c); - It’s a regression problem;
- It’s a non-linear (regression) problem;
Then, with that understanding in hand, it’s the moment to start to research available methods that could fit with these initial constraints. A quick look into the Internet, a method called Support Vector Regression (SVR) with non-linear kernel looks like a good fit with our initial assumptions.
After the implementation of this model/method, we could see promissing results:
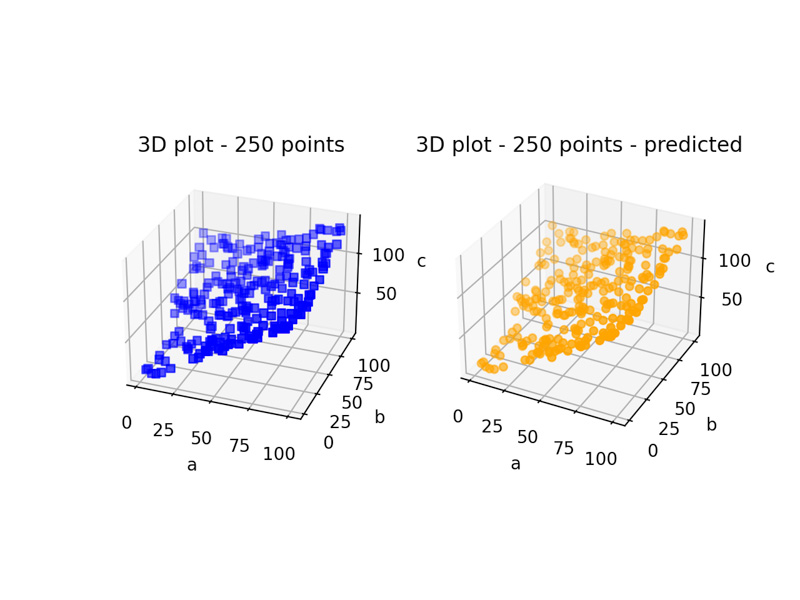
250 triples representation: Blue: real c values; Orange predicted c values by the model.
The coefficient of determination is 0.9974 (The best possible score is 1.0 and it can be negative (because the model can be arbitrarily worse). Not too bad, right?
However I will let you with some questions that still remain:
- Can this model extrapolate correctly?
- How many triples observarions are necessary to have an acceptable result?
- Is there another method (model) that could perform better?
Commentaires :
A lire également sur le sujet :